AWS Marketplace
ELK Stack Monitoring for Automated Smart Observability on AWS
ELK stack monitor and automated smart observability ELK stack on AWS (Elasticsearch, Logstash, Kibana) helps analyze logs with advanced...
ELK stack on AWS (Elasticsearch, Logstash, Kibana) helps analyze logs with advanced search, visualization, and alerting. Adopting cloud services results in increased log data that needs monitoring and analysis.AWS CloudWatch is a service for aggregating log data with limited analytics capabilities. Yet, setting up an ELK stack requires time and expe rtise.
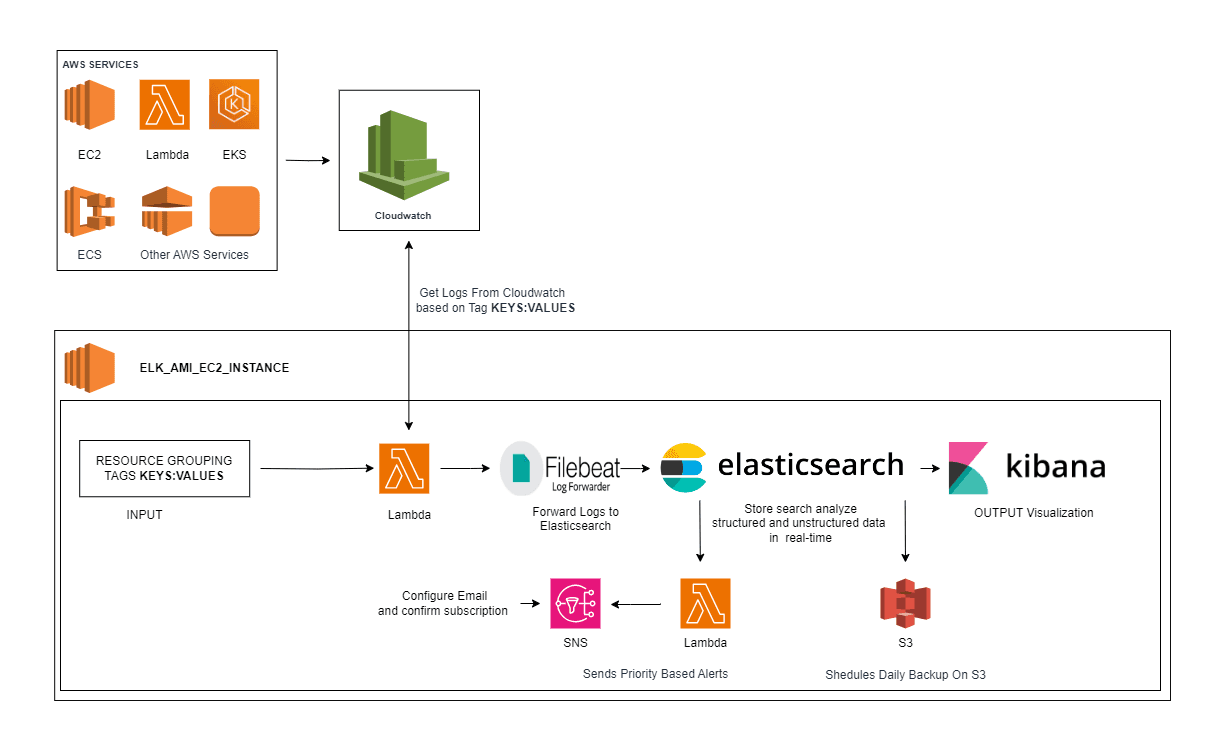
A Prebuilt ELK solution optimized for CloudWatch logs accelerates insights without taxing engineering resources. With an integrated data pipeline, CloudWatch logs are automatically shipped to Elasticsearch for storage and indexed for search. Kibana provides an intuitive interface to search logs, build dashboards and alerts, and share insights.
- Automated CloudWatch log indexing - Logs are automatically shipped from CloudWatch to Elasticsearch for storage and search indexing detection and mapping of new log types.
- Optimized storage and search - Elasticsearch clusters offer fast indexing and search with capabilities like sharding. Reliability comes through encryption and replication across zones. Storage scales up and down based on usage.
- Log parsing with Logstash - Out-of-the-box pipelines parse AWS logs like VPC Flow Logs, ECS, and ALB, into consistent fields/formats for analysis. Adding custom parsing rules to new log types is possible.
- Visual analytics with Kibana - Interactive dashboards provide insights into trends, outliers, and correlations. Users build custom charts, graphs, and geospatial views and share them securely across teams.
- Alerting - Threshold/anomaly detection alerts configured across logs to trigger notifications for events via email, Slack, PagerDuty, etc.
- Role-based access control - User roles and permissions allow them access to specific data sets and Kibana dashboard content.
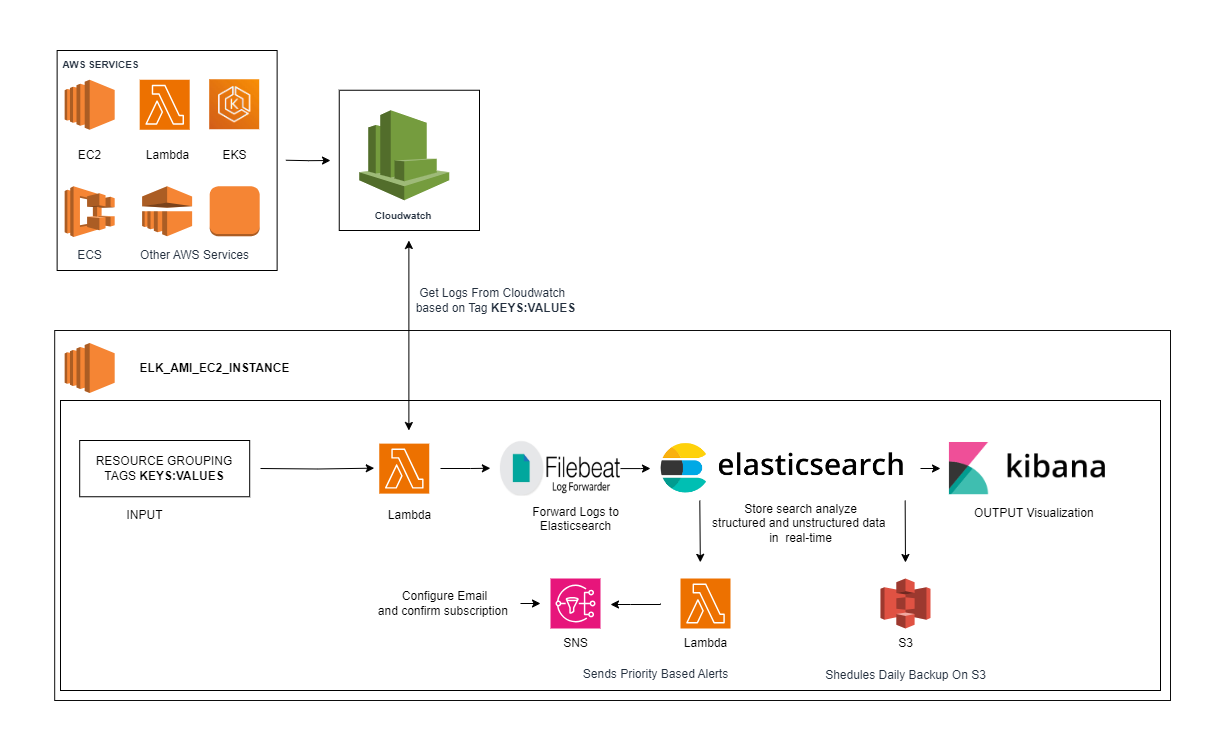
Prerequisites:TAG KEYS & Values: If your application uses multiple services or requires monitoring across various services, it is essential to tag them and enable CloudWatch monitoring. Otherwise, you will need to manually enable tags on cloudwatch.
- Open the Cloudwatch dashboard and open the Logs groups below the Logs
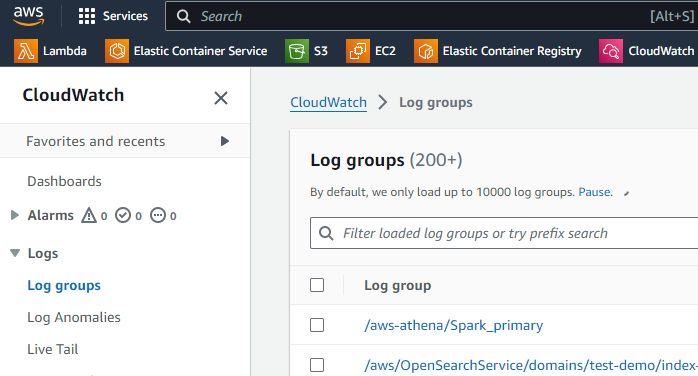
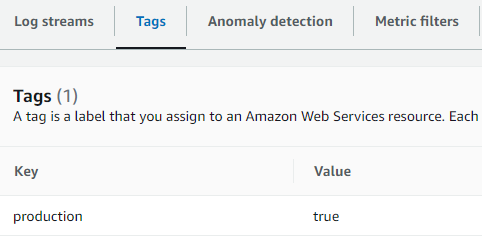
- Open the Cloudwatch Log Groups you want to add and click the Tags section then Add your Tag KEY and VALUE.
Features offered from our ELK Stack Monitoring for Automated Smart Observability on AWS
- Automated daily Backup on S3 named elasticsearchsnapshotfromelk
- Notification based on Priority through Email
Technical Usage Manual Step: 01
After subscribing to the AMI for ELK Monitoring Solutions from AWS Marketplace Choose the launch through EC2 and launch
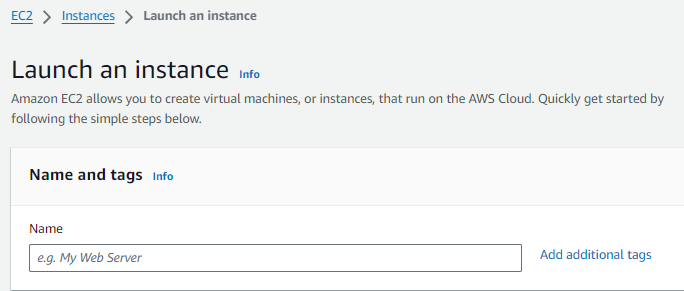
It redirects to the launch instance page and then configures the required details i.e., Name, Instance type, Keypair, Network Setting, and configure Storage
3. Go to the advanced setting below Configure storage
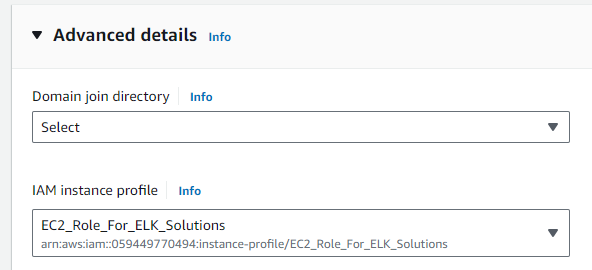
Click Create a New IAM Profile and choose Create Role.
On the Select trusted entity page, choose AWS service, select EC2, and click Next.
On the Add Permissions page, select the policies:
- Amazon EC2FullAccess
- AmazonS3FullAccess
- AmazonSNSFullAccess
- AWSLambda_FullAccess
- CloudWatchFullAccess
- IAMFullAccess
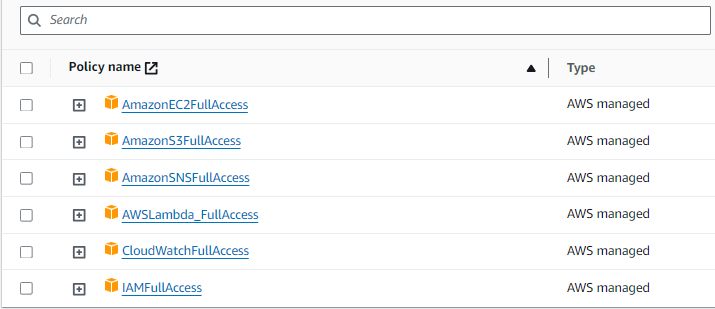
Enter a Name and description for the role. Choose Create role.
Attach the created role and click Launch instance
Go to the EC2 Dashboard and select your created instance. Copy the Public IP
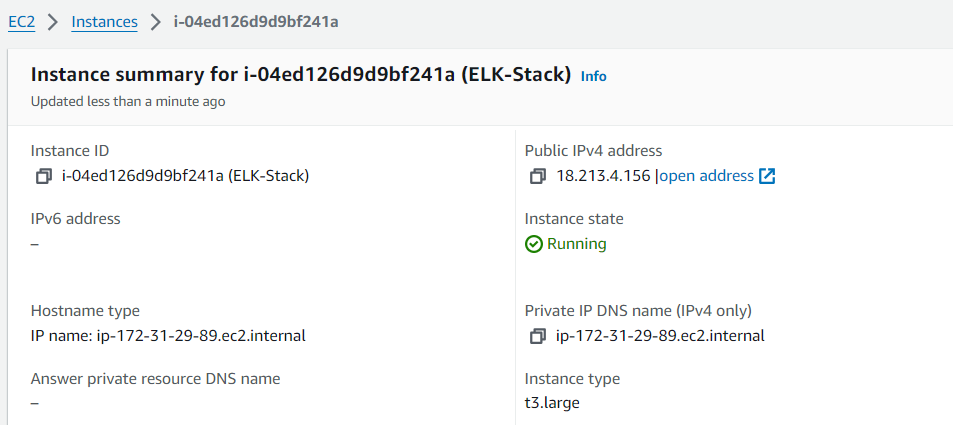
- Provide the Public IP in the browser: Ex: 35.174.170.139
11. The Login Page appears for ELK Monitoring Solutions.
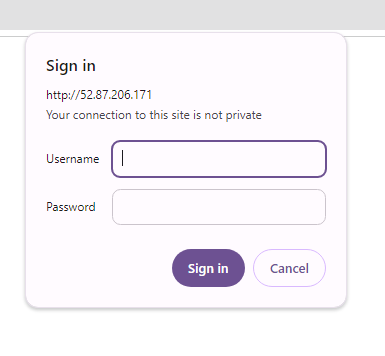
Enter Username: kibanaadmin
To get a Password Connect to an EC2 instance and run
sudo cat /home/ubuntu/password.txt
- After the Login, you are ready to perform your analytics on the ELK application with custom settings.
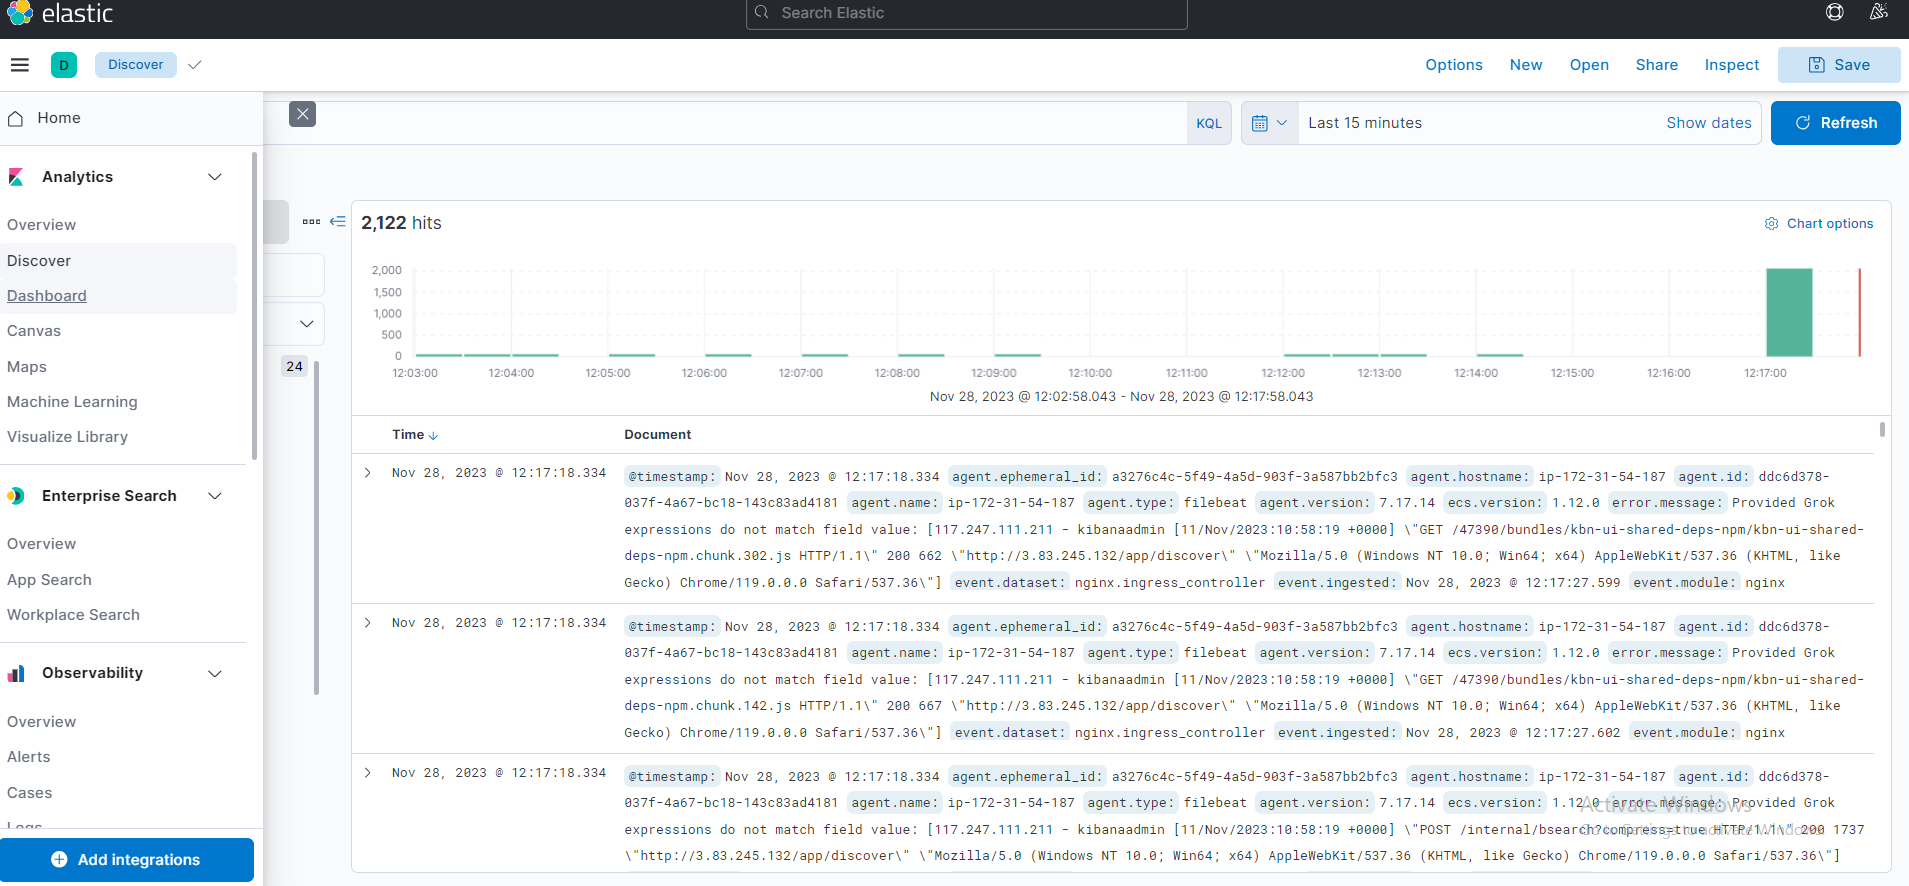
Export Tagged Cloudwatch Logs to ELK
Connect to the instance terminal using EC2 Instance Connect
Move to the Ubuntu directory using this command – sudo su && cd /home/ubuntu/
Open the Editor using this command – vi tag_data.json
Add the CloudWatch log group TAG KEYS and their VALUES to the tag.json file to export the CloudWatch logs to ELK. Here, we have provided an image for your reference.

If you have multiple tag KEYS&VALUES you should add them like this manually
Save and run the file: cloudwatchlog.py --json_file=tag_data.json
Cloudwatch Logs will be Started to Export On ELK Stack
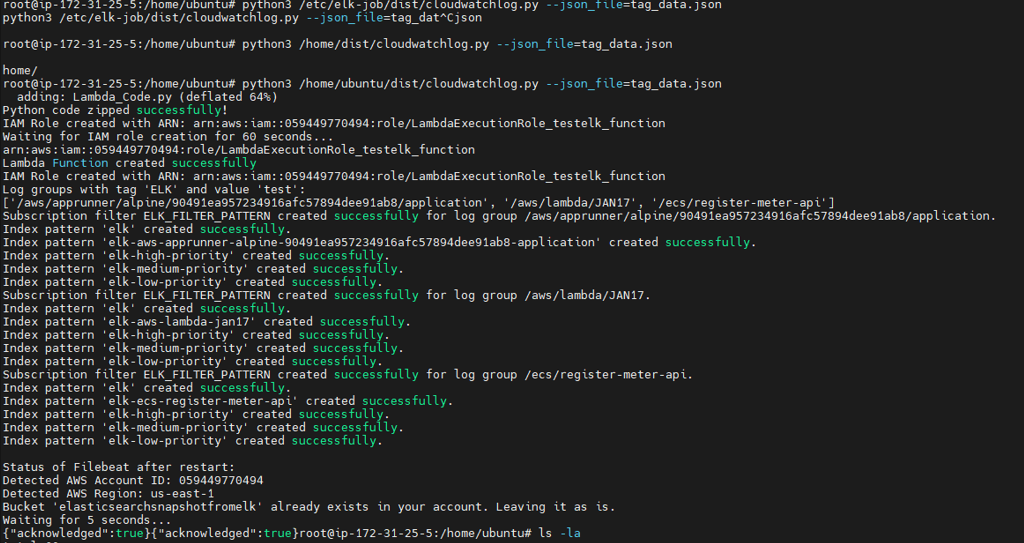
- After Executing the cloudwatchlog.py --json_file=tag_data.json successfully
Step : 02SNS configuration for Priority-based alerts using Lambda
- Open the Amazon SNS service in your console. There is a topic created with the name ELK_NOTIFICATION.
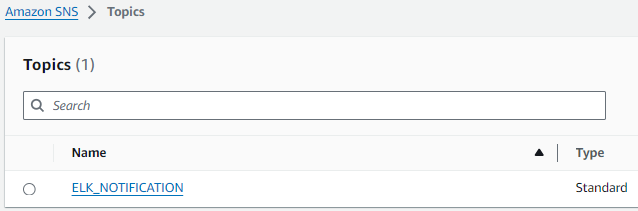
ELK_NOTIFICATION and Select Create Subscription
- Under Protocol choose the endpoint as Email and enter the Endpoint address, click on Create Subscription. Now, the subscription will be created and the status of the subscription is pending.
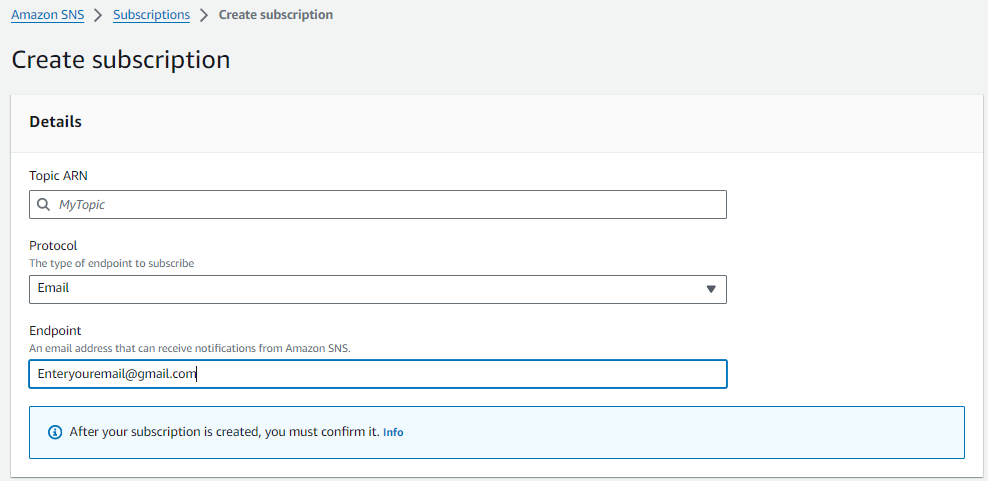
- The email will be sent to the subscriber to confirm the subscription. The subscriber has to open the email and click on Confirm Subscription. After this, the subscription will be confirmed.
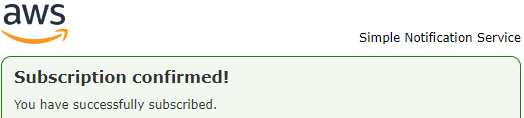
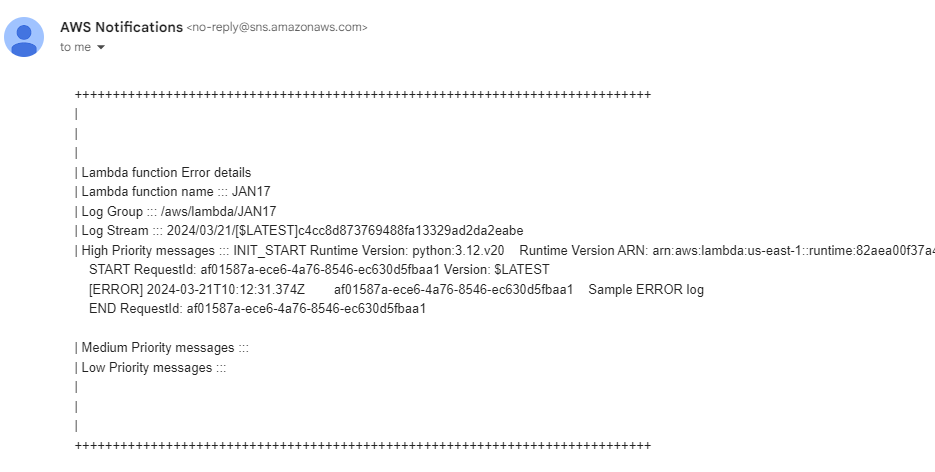
- After the Subscription is Confirmed you will start to receive Priority based alerts through Email
Step : 03Sheduled Backup on S3 Daily
- Now daily logs on Elasticsearch will store snapshots on S3 named elasticsearchsnapshotfromelk
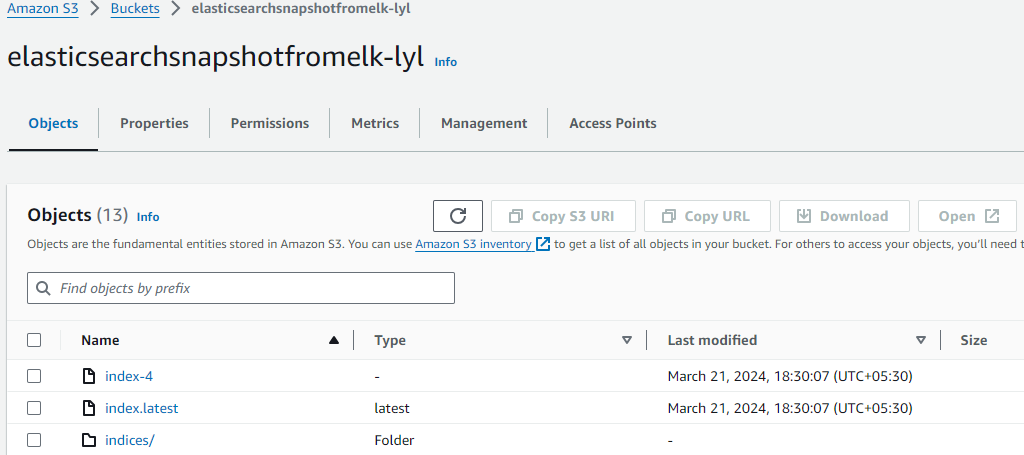
- It can be restored anytime even if all the data is lost on Elastic search
3. Now you can log in to Kibana Dashboard and create a dashboard with your requirements
Step :04Creating a Dashboard on Kibana
Open the Kibana Dashboard. Click Create Dashboard.
select Create visualization
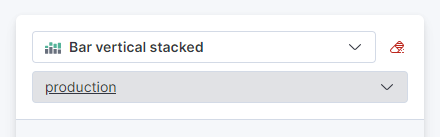
Select your created index on the right corner
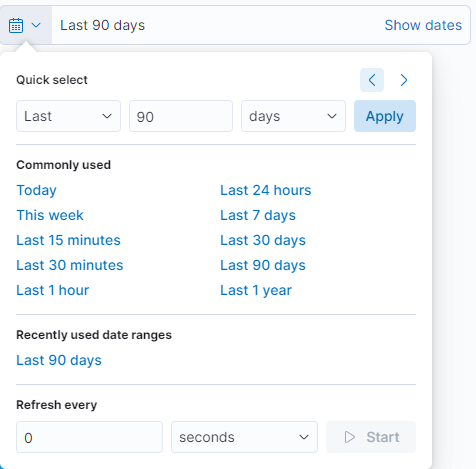
Set the time filter to Last 90 days
- Drag and drop the fields that are available below the filter by type named under the available fields. Here, for ex:- Select Message.keyword Drag into fields
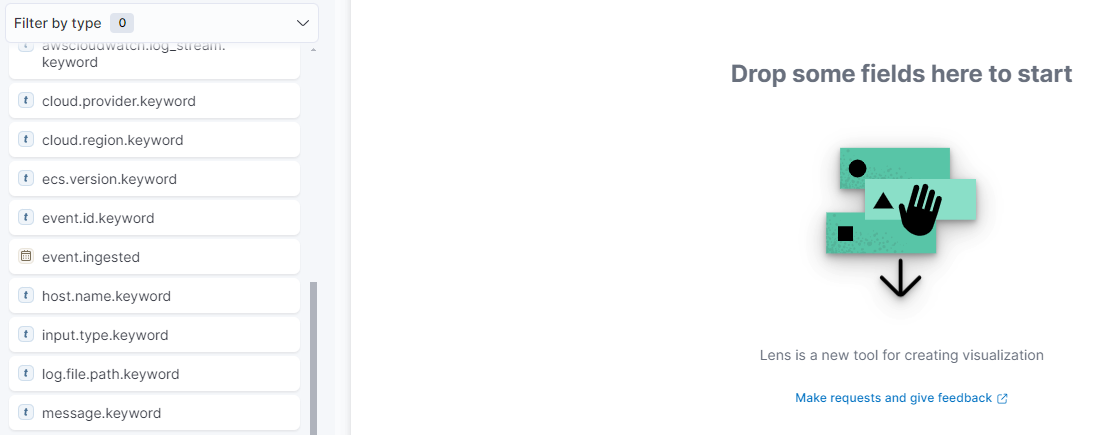
You can also add more fields on available fields and select a list of suggested visualizations as we need
Now the logs are in detailed visualization
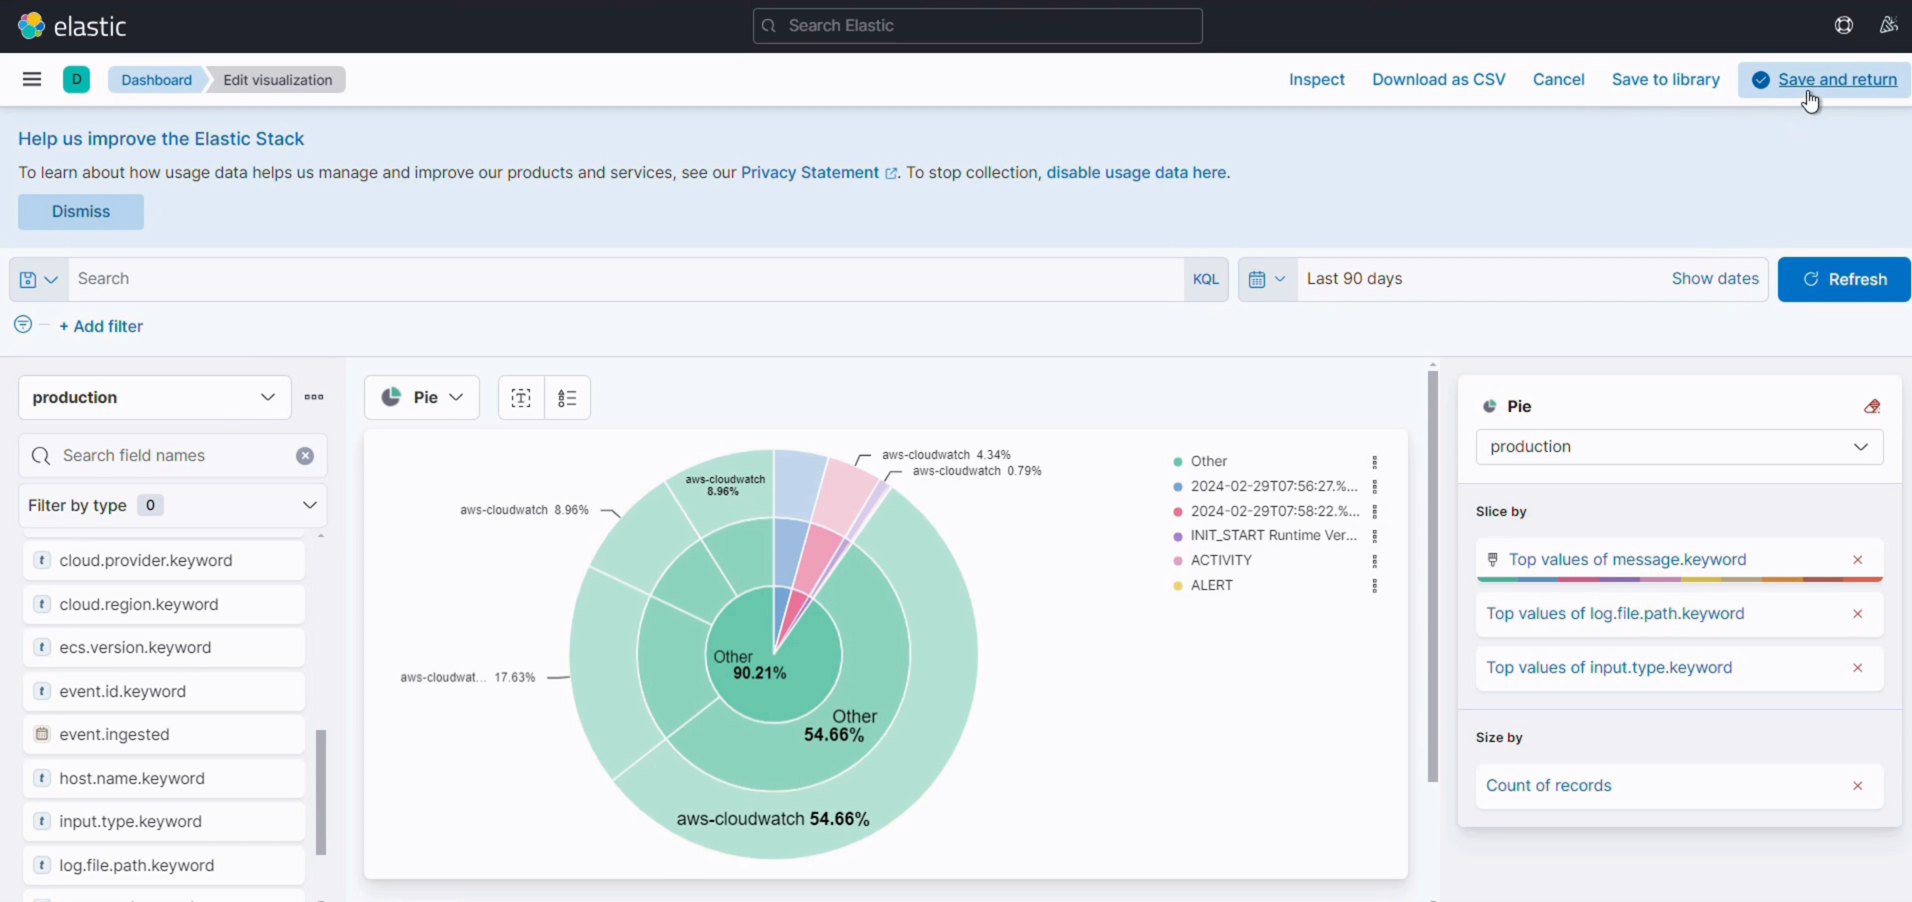
- To save and view the fields click the “save and return” option on the right corner of the dashboard
Save With the desired Name for the dashboard
Insights & Support
- For further details about the ELK stack and its uses, refer to the ELK Stack website
- We will do our best to respond to your questions within the next 24 hours in business days. For any technical support or query, you can drop a mail to support@yobitel.com.
- Check our other Containerized Cloud-Native application stacks, such as EKS, ECS, Cloud Formation, and AMI - Amazon Machine Images in AWS Marketplace.